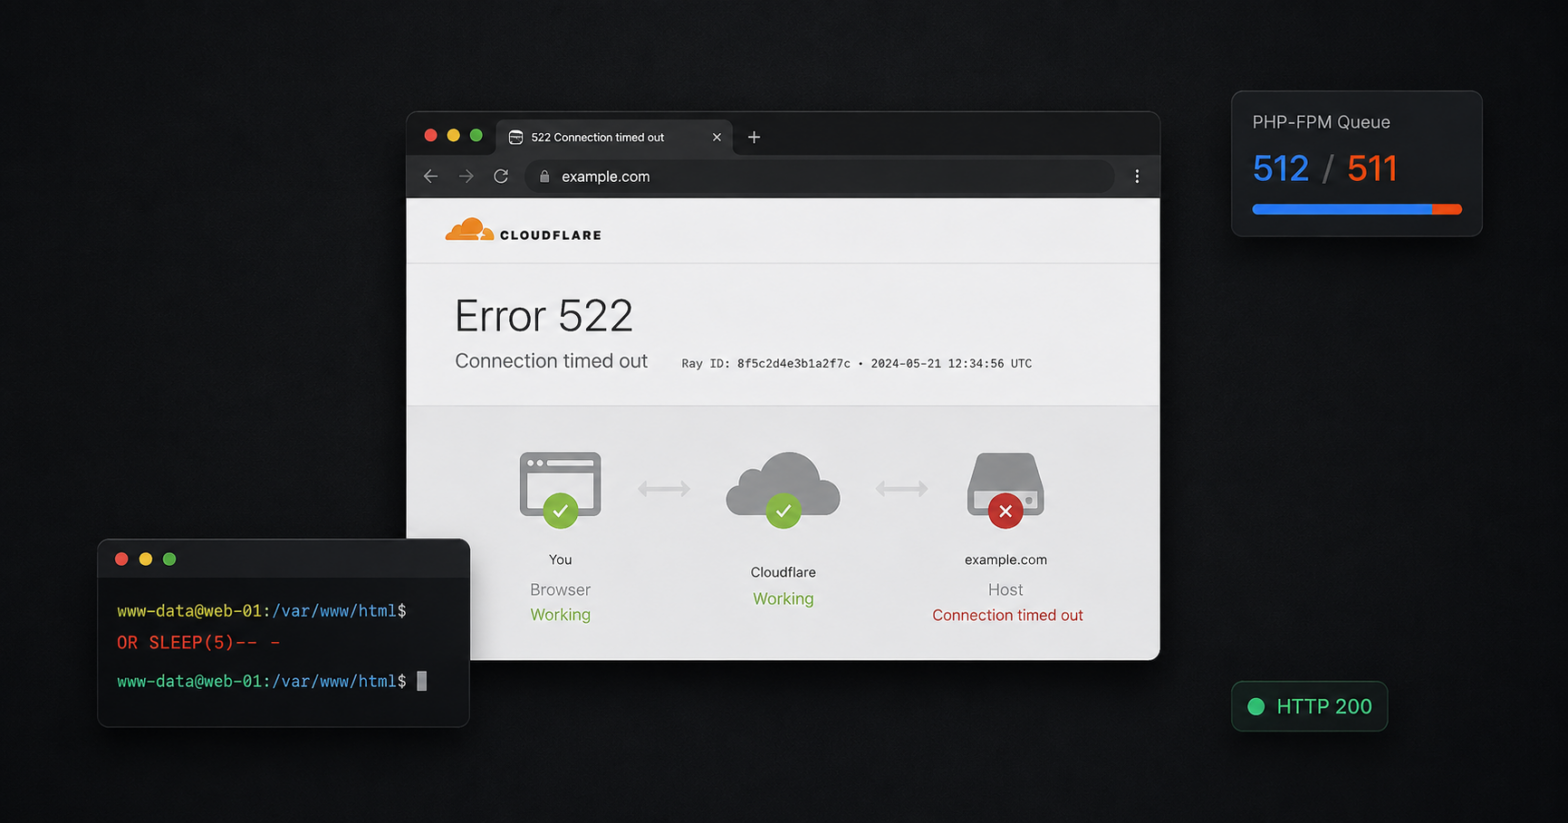
Recently, a WordPress and WooCommerce site I manage stopped responding and started returning a Cloudflare 522 error.
The server looked healthy. CPU was low, memory was free, disk space was fine, and Apache, PHP-FPM, and MariaDB were all running. Nothing in the usual first places pointed at a cause.
The clue came from one comparison. A static file loaded instantly. Every PHP request timed out.
Tracing a single request through the web server, PHP-FPM, and MariaDB turned up the answer: multiple SQL-injected queries carrying SLEEP(5). They had taken every PHP worker, filled the PHP-FPM socket queue, and left normal WordPress and WooCommerce queries waiting on database locks.
This tutorial walks through the exact investigation and recovery. The diagnostic sequence applies to Linux servers running PHP-FPM with MySQL or MariaDB. Service names, socket locations, and the web-server validation commands vary between Apache, nginx, and the different hosting panels, so adjust those to your own stack.
This guide applies when the origin accepts connections, a known static file loads, and PHP requests time out on a site backed by PHP-FPM and MySQL or MariaDB. If the static file also fails, the problem is more likely in the network, firewall, web server, or TLS layer, so look there before touching the database.
What I found
The incident produced this chain:
Cloudflare returned 522
↓
The origin accepted connections but PHP requests did not finish
↓
Static files continued to work
↓
All PHP-FPM workers became occupied
↓
The PHP-FPM socket queue reached its limit
↓
MariaDB contained long-running injected queries
↓
Normal WordPress queries waited for table locks
↓
Apache eventually stopped completing requests
The Cloudflare error was the last symptom, not the fault. The real blockage sat much deeper in the stack.
Before restarting anything
Restarting Apache or PHP-FPM might bring the site back for a minute. It also wipes the evidence you need to explain why it went down. So I captured a snapshot of the server state first.
echo '=== TIME AND LOAD ==='
date -u
uptime

echo
echo '=== MEMORY ==='
free -h

echo
echo '=== DISK ==='
df -h /

echo
echo '=== WEB PORTS ==='
ss -lntp | grep -E ':(80|443)\b' || true

echo
echo '=== WEB, PHP, AND DATABASE SERVICES ==='
systemctl --no-pager --type=service --state=running \
  | grep -Ei 'apache2|httpd|nginx|php.*fpm|mysql|mariadb' || true
There was no system-wide resource shortage. CPU load was low, memory was plentiful, disk and inode usage were normal, and every required service was up. But the web server connection queue was full. Apache was listening, and requests were arriving faster than the application could clear them.
Test the origin directly
When a site sits behind Cloudflare or another reverse proxy, test the origin on its own. That tells you whether the proxy is the problem or just reporting an origin that already failed.
Set the domain and origin IP:
DOMAIN=example.com
ORIGIN_IP=203.0.113.10
Then send an HTTPS request straight to the origin while keeping the correct hostname. Because --resolve preserves the real domain, run it without -k first, so certificate validation still happens:
curl -sv \
  --connect-timeout 5 \
  --max-time 20 \
  --resolve "$DOMAIN:443:$ORIGIN_IP" \
  "https://$DOMAIN/" \
  -o /dev/null
The TLS handshake completed, but the request returned no HTTP response before timing out. That ruled out a TLS negotiation failure.
If the origin serves a Cloudflare Origin CA certificate that the local machine does not trust, the validated request will fail on trust alone. Add -k to get past validation in that case, but read the result narrowly. It proves TLS can be negotiated, not that the certificate is trusted, unexpired, or correct for the hostname.
curl -skv \
  --connect-timeout 5 \
  --max-time 20 \
  --resolve "$DOMAIN:443:$ORIGIN_IP" \
  "https://$DOMAIN/" \
  -o /dev/null
Note: Testing 127.0.0.1:443 is not always reliable. Some virtual hosts bind specifically to the public server IP. Use the address shown in your Apache or nginx configuration.
Compare a static file with a PHP request
This was the most useful test in the whole investigation, and the one place people get it wrong. The trick is picking a static file that really is static. Do not use /robots.txt: on many sites WordPress serves a virtual robots.txt through PHP, so the request enters the exact code path you are trying to rule out. Drop a known physical file in the document root instead, and delete it afterward.
DOCROOT=/path/to/wordpress
STATIC_TEST=.origin-static-test.txt
printf 'static-ok\n' > "$DOCROOT/$STATIC_TEST"

echo '=== STATIC FILE ==='
curl -sk -o /dev/null \
  -w 'Static: HTTP %{http_code} in %{time_total}s\n' \
  --connect-timeout 5 \
  --max-time 10 \
  --resolve "$DOMAIN:443:$ORIGIN_IP" \
  "https://$DOMAIN/$STATIC_TEST"

echo
echo '=== PHP REQUEST ==='
curl -sk -o /dev/null \
  -w 'PHP: HTTP %{http_code} in %{time_total}s\n' \
  --connect-timeout 5 \
  --max-time 10 \
  --resolve "$DOMAIN:443:$ORIGIN_IP" \
  "https://$DOMAIN/index.php?diagnostic-test=1"

rm -f "$DOCROOT/$STATIC_TEST"
The output:
Static: HTTP 200 in 0.004 seconds
PHP: HTTP 000 in 10.002 seconds
That drew a clean line under the problem. The web server, SSL, virtual host, and static file delivery all worked. The failure started the moment a request entered PHP.
Inspect the PHP-FPM pool and socket queue
The PHP-FPM pool for this site allowed a maximum of 16 workers:
pm.max_children = 16
pm.start_servers = 2
pm.min_spare_servers = 1
pm.max_spare_servers = 8
On a typical Linux server, the pool configuration lives under:
/etc/php/*/fpm/pool.d/List the settings that matter here with:
grep -RhnE \
  '^[[:space:]]*(listen|pm\.max_children|pm\.max_requests|request_terminate_timeout|request_slowlog_timeout|slowlog)[[:space:]]*=' \
  /etc/php/*/fpm/pool.d/
Then find the Unix socket the site uses and inspect its queue:
FPM_SOCKET=/path/to/the-site.sock

ss -xlpn | grep "$FPM_SOCKET"
The affected socket showed:
u_str LISTEN 512 511 /path/to/the-site.sockThe receive queue held 512 pending connections against a backlog of 511. Every worker was busy, and hundreds of requests were stacked up waiting for one to free.
Restarting PHP-FPM cleared the queue, then it filled straight back up. The restart was removing the blocked workers without touching whatever kept blocking them.
Inspect active database queries with WP-CLI
The workers were all blocked on the same thing, and it lived in the database. WP-CLI was the quickest way to look, because it reads the credentials straight from wp-config.php. No database password on the command line.
cd /path/to/wordpress

wp db query "
SELECT
    ID,
    USER,
    IFNULL(DB, '-'),
    COMMAND,
    TIME,
    IFNULL(STATE, '-'),
    LEFT(
        REPLACE(REPLACE(IFNULL(INFO, ''), CHAR(10), ' '), CHAR(13), ' '),
        180
    ) AS QUERY_TEXT
FROM information_schema.PROCESSLIST
WHERE COMMAND <> 'Sleep'
  AND ID <> CONNECTION_ID()
ORDER BY TIME DESC
LIMIT 30;
" --allow-root
That surfaced several queries like this:
SELECT SQL_CALC_FOUND_ROWS wp_posts.ID
FROM wp_posts
WHERE 1=1
AND wp_posts.post_author NOT IN (0) OR SLEEP(5)-- -)
Several copies had been running for hours. Meanwhile the legitimate WordPress and WooCommerce queries all sat in one state:
Waiting for table level lockThe cause was now proven. User-controlled input had rewritten a WordPress query and slipped in a call to SLEEP(5).
What the injected query was doing
The injected fragment:
0) OR SLEEP(5)-- -0) closes the original SQL expression. OR SLEEP(5) adds the attacker’s own database function. -- - comments out the legitimate SQL that came after it.
SLEEP() is a standard way to test time-based SQL injection. A delayed response confirms the injected SQL ran, even when the attacker cannot read the result directly.
The strange part was the duration. These were not tidy five-second queries. Some had been active for more than nine hours. I cannot prove from the available logs whether that was deliberate or a side effect of how the expression evaluated. What is clear: the queries stayed alive, normal requests piled up behind their table locks, and every PHP worker eventually went unavailable.
Recover the website safely
With the malicious pattern confirmed, I killed only the sessions that matched it.
cd /path/to/wordpress

IDS=$(wp db query "
SELECT ID
FROM information_schema.PROCESSLIST
WHERE DB = DATABASE()
  AND ID <> CONNECTION_ID()
  AND INFO IS NOT NULL
  AND INFO NOT LIKE '%information_schema.PROCESSLIST%'
  AND (
      LOWER(INFO) LIKE '%sleep(%'
      OR LOWER(INFO) LIKE '%benchmark(%'
  );
" --skip-column-names --allow-root)

if [ -n "$IDS" ]; then
    echo 'Killing confirmed suspicious sessions:'
    echo "$IDS"

    for ID in $IDS; do
        wp db query "KILL CONNECTION $ID;" \
          --allow-root \
          >/dev/null 2>&1 || true
    done
else
    echo 'No matching sessions found.'
fi
Important: Do not kill every long-running query. Imports, backups, reports, and maintenance jobs can legitimately take time. Only terminate a query after you have read its SQL and confirmed the pattern.
The site was on WordPress 7.0 at the time. I stopped incoming traffic, restarted PHP-FPM to drop the queued work, and updated to the patched 7.0.2 release.
WEB_SERVICE=apache2
PHP_SERVICE=php8.1-fpm
PATCHED_VERSION=7.0.2
SITE_USER=example
DOCROOT=/home/example/public_html

systemctl stop "$WEB_SERVICE"
systemctl restart "$PHP_SERVICE"

sudo -u "$SITE_USER" -H wp core update \
  --version="$PATCHED_VERSION" \
  --force \
  --path="$DOCROOT"

sudo -u "$SITE_USER" -H wp core version --path="$DOCROOT"
Run the update as the account that owns the WordPress files, not as root. The diagnostic reads earlier used --allow-root because they only query state, but a core update writes to the filesystem, and updating as root can leave files owned by the wrong user on servers where the site runs under an isolated hosting account. On nginx, swap apache2 for your nginx service. On a different PHP version, use the PHP-FPM service installed on that server. For a live incident, use the patched release recommended for the WordPress branch you are on rather than copying the version number from this example.
It helps to know what that update actually closes. WordPress 7.0.2 patched two separate issues: an SQL injection in WP_Query::author__not_in (CVE-2026-60137) and a REST API batch-route confusion vulnerability (CVE-2026-63030). On affected versions the two could be chained to reach remote code execution. The injected post_author NOT IN (0) query and the repeated requests to the batch endpoint are consistent with that chain. I cannot prove the exact inner batch request used here, because the POST body was never recorded. If you are on an affected version and cannot update immediately, blocking /wp-json/batch/v1 and the rest_route=/batch/v1 parameter at the WAF buys time until you patch.
Verify the core files
After updating, I checked the core files against the official checksums:
sudo -u "$SITE_USER" -H wp core verify-checksums \
  --version="$PATCHED_VERSION" \
  --locale=en_GB \
  --path="$DOCROOT"
Use the locale the site actually runs. Verifying an en_GB package against another locale will produce checksum mismatches that mean nothing.
WP-CLI also flagged some extra error_log files inside core directories. Those files are not part of the official package, but that does not make them malicious on its own. I reviewed them separately instead of deleting them blindly.
Restart and verify every layer
With the sessions cleared and WordPress patched, I restarted the services and tested the full request path again.
systemctl restart "$PHP_SERVICE"

# Use the matching validation command for your web server.
apache2ctl configtest && systemctl restart "$WEB_SERVICE"

sleep 3

echo '=== PHP-FPM QUEUE ==='
ss -xlpn | grep "$FPM_SOCKET"

echo
echo '=== DIRECT ORIGIN ==='
curl -sk -o /dev/null \
  -w 'Origin: HTTP %{http_code} in %{time_total}s\n' \
  --connect-timeout 5 \
  --max-time 20 \
  --resolve "$DOMAIN:443:$ORIGIN_IP" \
  "https://$DOMAIN/"

echo
echo '=== PUBLIC WEBSITE ==='
curl -sS -o /dev/null \
  -w 'Public: HTTP %{http_code} in %{time_total}s\n' \
  --connect-timeout 10 \
  --max-time 30 \
  "https://$DOMAIN/"
The final result:
PHP-FPM queue: 0
Origin: HTTP 200
Public website: HTTP 200
Find the original request in the access logs
The database query showed what reached MariaDB. It did not show the HTTP request that started it.
Once the blocked requests were gone, I searched the current and rotated access logs for the WordPress REST batch endpoint and for SQL injection markers.
ACCESS_LOG=/path/to/site-access.log

zcat -f "${ACCESS_LOG}"* 2>/dev/null \
  | grep -Ei \
    '(/wp-json/batch/v1|rest_route=[^"]*batch(%2f|/)v1|sleep(%28|\())' \
  | tail -80
The pattern was a run of requests to:
POST /?rest_route=/batch/v1The first ones returned HTTP 207. Later ones returned 504 and 503 as the database and the PHP-FPM pool locked up. The log gave me the endpoint, method, timestamp, status, and user agent.
It did not give me the JSON request body. A normal Apache or nginx access log does not record POST bodies, so I could not reconstruct the exact inner batch request after the fact.
What the evidence proved, and what it did not
The logs support a specific chain of events. The site failed only once requests entered PHP. Every PHP-FPM worker filled up, the socket queue hit its backlog limit, and MariaDB held multiple queries carrying an injected SLEEP(5) while the real WordPress and WooCommerce queries waited on table locks. The access log showed repeated POST requests to the REST batch endpoint. The site was on WordPress 7.0, and killing the injected queries, clearing PHP-FPM, patching to 7.0.2, and restarting the web server brought it back.
The evidence also has limits, and it is worth being honest about them. I could not recover the POST body from a normal access log. I could not prove whether the attacker meant to cause an outage or just stumbled into one. I could not explain exactly why each query stayed active for so long. I found no unexpected administrator account, though that alone does not prove nothing else was attempted. In security work those distinctions matter. The logs should define the conclusion, not the reverse.
What I would monitor next time
A standard uptime monitor would only have told me the site was down. The signals that actually mattered showed up before the outage: a static health check passing while a PHP health check failed, the PHP-FPM receive queue climbing, active workers hitting pm.max_children, database queries running well past their normal duration, the WordPress database user calling functions like SLEEP(), and table lock waits piling up. One more signal sat outside the runtime entirely. Because of the severity, WordPress had enabled forced automatic updates for the affected installations, yet this site was still on 7.0 when it was hit. That is the lesson worth keeping. Monitoring whether auto-updates are enabled is not enough. After a critical security release, you have to check the installed version to confirm the update actually landed.
That monitoring has to run outside WordPress. Once every PHP worker is occupied, a plugin living inside the affected application may not have the capacity to report anything.
I would also enable a PHP-FPM slow log and a carefully tested request timeout:
request_slowlog_timeout = 20s
slowlog = /var/log/php-fpm-site-slow.log
request_terminate_timeout = 180s
pm.max_requests = 500
Treat those as examples, not universal settings. Sites that run long imports, exports, backups, or image processing may need very different limits. And raising pm.max_children on its own would not have saved this site. It would only have let more blocked requests reach the database before the server gave out.
Final takeaway
The Cloudflare 522 made this look like a network or hosting failure. The server was healthy and static files kept serving the whole time. The real failure was inside WordPress, and the only way to see it was to follow one request down through each layer: the origin, static versus PHP, the FPM queue, the MariaDB process list, and finally the injected query itself.
Restarting services on repeat would have bought a few minutes each time and explained nothing. Walking the request down one layer at a time made the real cause visible and let me recover the site without guessing.