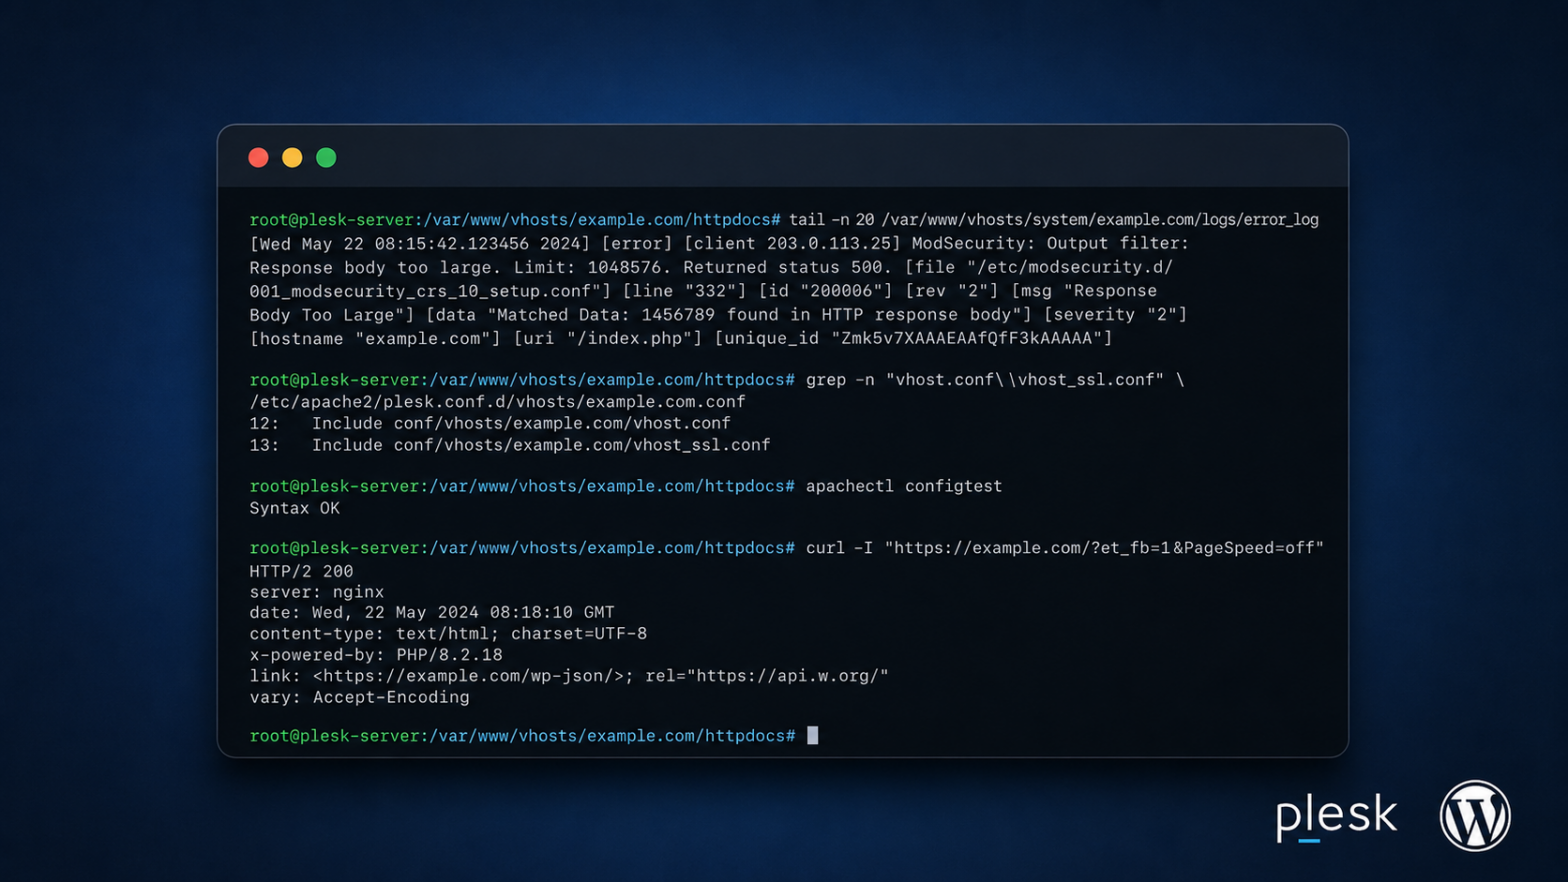
Recently, I had to debug a WordPress issue on a Plesk server where the only visible symptom was a server error on a specific editor page.
At first, the report was vague. The site was working in normal browsing, but editing in visual mode was failing. That kind of report can easily send you in the wrong direction if you start changing PHP settings, disabling plugins, or reading huge log files without a plan.
This post is not a generic “fix WordPress 500 errors” checklist. Those lists usually create more noise than clarity. This is the cleaner workflow I use on Plesk servers to trace the actual failing request, match it to the right log entry, and only then decide what needs to change.
Start by confirming the domain and document root
Before looking at logs, confirm which Plesk domain you are working on and where the WordPress files live. On Plesk, WordPress sites are usually under /var/www/vhosts/DOMAIN/httpdocs, but I still prefer to verify instead of assuming.
plesk bin domain --info example.com | sed -n '1,120p'

find /var/www/vhosts/example.com -maxdepth 4 -type f \
  \( -name wp-config.php -o -name index.php \) \
  -printf '%p\n' | sed -n '1,120p'
Replace example.com with the actual Plesk domain. The goal here is simple: confirm the domain exists in Plesk, confirm the document root, and confirm whether you are dealing with a WordPress install before going further.
Use the domain logs, not random global logs first
Plesk keeps domain-specific logs under the domain’s system directory. For Apache and nginx proxy setups, the useful files are usually here:
/var/www/vhosts/system/example.com/logs/error_log
/var/www/vhosts/system/example.com/logs/access_ssl_log
/var/www/vhosts/system/example.com/logs/proxy_error_log
/var/www/vhosts/system/example.com/logs/proxy_access_ssl_log
Do not start with a full cat or a huge recursive grep. Large logs make it harder to see the pattern. Start small.
ls -lh /var/www/vhosts/system/example.com/logs/

tail -n 80 /var/www/vhosts/system/example.com/logs/error_log
If the issue just happened, the last 80 to 150 lines are usually enough to see whether you are dealing with a PHP fatal error, Apache error, ModSecurity block, permission problem, proxy issue, or unrelated plugin warning.
Find the exact failing request
The most useful piece of information is the request path that failed. For WordPress admin or editor issues, that might be something like:
/wp-admin/post.php/wp-admin/admin-ajax.php/wp-json/.../?et_fb=1&PageSpeed=offfor Divi Visual Builder
When you know the approximate time, search a narrow time window. Start with access logs and only show errors or suspicious statuses.
awk '$9 ~ /^[45][0-9][0-9]$/ {print}' \
  /var/www/vhosts/system/example.com/logs/access_ssl_log \
  | tail -n 80

awk '$9 ~ /^[45][0-9][0-9]$/ {print}' \
  /var/www/vhosts/system/example.com/logs/proxy_access_ssl_log \
  | tail -n 80
If you have the exact time, filter around that window instead of scanning the whole file.
grep "20/May/2026:07:" /var/www/vhosts/system/example.com/logs/access_ssl_log \
  | awk '$9 ~ /^[45][0-9][0-9]$/ {print}' \
  | sed -n '1,160p'
Adjust the date and hour to match your case. Keep the output small enough that you can actually read it.
Do not trust one log file only
One important thing I had to remind myself of during this investigation: the failed request may not always appear clearly in the access log.
Access logs usually record completed requests. If Apache fails while passing the response through an output filter, or the request dies before normal logging completes, the clearest entry may only appear in error_log.
That is why I check both access and error logs around the same time.
echo "=== Recent 4xx/5xx access entries ==="
awk '$9 ~ /^[45][0-9][0-9]$/ {print}' \
  /var/www/vhosts/system/example.com/logs/access_ssl_log \
  | tail -n 80

echo
echo "=== Recent error log entries ==="
tail -n 120 /var/www/vhosts/system/example.com/logs/error_log

echo
echo "=== Recent proxy errors ==="
tail -n 80 /var/www/vhosts/system/example.com/logs/proxy_error_log
Check rotated logs when the current log looks empty
This is easy to miss on Plesk. If the current access log does not show the request, check processed and compressed logs too.
for pattern in \
"/var/www/vhosts/system/example.com/logs/access_ssl_log*" \
"/var/www/vhosts/system/example.com/logs/proxy_access_ssl_log*" \
"/var/www/vhosts/system/example.com/logs/access_log*" \
"/var/www/vhosts/system/example.com/logs/proxy_access_log*"
do
  echo
  echo "--- $pattern ---"
  zgrep -h "20/May/2026:07:" $pattern 2>/dev/null \
    | awk '$9 ~ /^[45][0-9][0-9]$/ {print}' \
    | sed -n '1,160p'
done
Using zgrep lets you search both normal and compressed log files without manually checking each one.
Filter by IP when you have it
If the error log shows an IP address, use it to reconstruct what happened before the failure. The failing request may be missing, but the requests just before it often reveal the user flow.
for pattern in \
"/var/www/vhosts/system/example.com/logs/access_ssl_log*" \
"/var/www/vhosts/system/example.com/logs/proxy_access_ssl_log*" \
"/var/www/vhosts/system/example.com/logs/access_log*" \
"/var/www/vhosts/system/example.com/logs/proxy_access_log*"
do
  echo
  echo "--- $pattern ---"
  zgrep -h "203.0.113.10" $pattern 2>/dev/null \
    | grep "20/May/2026" \
    | sed -n '1,220p'
done
Replace 203.0.113.10 with the IP from your error log. In my case, this showed the user opening the homepage, entering the editor flow, and then triggering the failing Divi visual builder request.
Build a compact request timeline
Raw access logs are noisy. Once you have a time window, reduce each line to the pieces that matter: time, IP, status, bytes, method, and path.
for pattern in \
"/var/www/vhosts/system/example.com/logs/access_ssl_log*" \
"/var/www/vhosts/system/example.com/logs/proxy_access_ssl_log*" \
"/var/www/vhosts/system/example.com/logs/access_log*" \
"/var/www/vhosts/system/example.com/logs/proxy_access_log*"
do
  zgrep -h "20/May/2026:07:" $pattern 2>/dev/null
done \
| awk '{
    ip=$1; time=$4; method=$6; path=$7; status=$9; bytes=$10;
    gsub(/\[/,"",time); gsub(/"/,"",method);
    print time, ip, status, bytes, method, path
  }' \
| sed -n '1,260p'
This makes patterns easier to see. You can quickly spot whether the issue is tied to a specific editor URL, REST endpoint, AJAX call, or frontend page.
Separate the real failure from unrelated noise
WordPress logs often contain multiple problems at once. That does not mean every problem caused the current incident.
In my case, there were unrelated warnings from an old migrated MU plugin and repeated database errors from a plugin. Both were worth cleaning up or flagging, but neither explained the exact visual builder failure.
The real failure had to match all of these:
- The same time as the reported issue
- The same IP Address or user flow
- The same URL or feature being used
- A server error that explains the visible symptom
If an error appears hours earlier, or on a different admin page, do not immediately treat it as the cause. Keep it in the notes, but keep tracing.
Reproduce with a small test, then check the log again
Once I had a likely URL, I reproduced the issue in the browser and immediately checked the logs again. This is better than asking someone else to describe the issue repeatedly.
tail -n 120 /var/www/vhosts/system/example.com/logs/error_log \
  | grep -Ei "fatal|error|warning|denied|forbidden|permission|timeout|proxy|upstream|security|php message" \
  | tail -n 60
The important part is that the log entry should be new and should match the request you just tested. Old errors can stay in the log for days, so always compare timestamps.
Measure response size without dumping the response
Sometimes the issue is related to response size, redirects, or a server-side block. You can check the HTTP status and downloaded size without printing the full page output.
curl -k -L -s -o /dev/null \
  -w "HTTP %{http_code} | downloaded %{size_download} bytes | final URL %{url_effective}\n" \
  "https://example.com/"
This is useful because it gives you a clean result without filling your terminal with HTML or JSON.
Note: anonymous curl requests are not always the same as logged-in browser requests. For editor issues, the browser request may include cookies, admin state, builder assets, or a different response path. Use curl as one data point, not as the only proof.
Check Plesk custom Apache config before changing it
If the issue points to Apache or ModSecurity, do not immediately create or overwrite custom config files. First check what already exists and what Plesk includes.
ls -lah /var/www/vhosts/system/example.com/conf

grep -n "vhost.conf\|vhost_ssl.conf\|mod_security\|SecResponseBody" \
  /etc/apache2/plesk.conf.d/vhosts/example.com.conf \
  /var/www/vhosts/system/example.com/conf/httpd.conf \
  2>/dev/null
This avoids two common mistakes:
- Adding duplicate directives in the wrong place
- Using the wrong module wrapper or assuming a file is included when it is not
On Plesk, when vhost.conf and vhost_ssl.conf exist, Plesk can include them inside the generated Apache vhost config after reconfiguration. But verify that on the server before relying on it.
Apply the smallest domain-level fix
Once you have the confirmed log entry, fix that specific problem only. Do not disable plugins, change global PHP settings, or turn off server security unless the logs actually point there.
In my case, the error pointed to the server security layer blocking a large response body. So the fix was not a WordPress change. It was a small Plesk domain-level Apache override for this one site.
Important: the following config is specific to a confirmed response body limit issue. Do not copy it for every WordPress server error.
cat > /var/www/vhosts/system/example.com/conf/vhost.conf <<'EOF'
<IfModule mod_security2.c>
    SecResponseBodyLimit 3145728
    SecResponseBodyLimitAction ProcessPartial
</IfModule>
EOF

cat > /var/www/vhosts/system/example.com/conf/vhost_ssl.conf <<'EOF'
<IfModule mod_security2.c>
    SecResponseBodyLimit 3145728
    SecResponseBodyLimitAction ProcessPartial
</IfModule>
EOF

plesk sbin httpdmng --reconfigure-domain example.com
apachectl configtest
Only reload Apache if the config test returns Syntax OK.
systemctl reload apache2I used a 3 MB limit because the default 1 MB limit was confirmed too low for that specific builder response. I did not use an unlimited value, and I did not disable the security layer for the whole server.
Verify the fix after reload
After applying any server-level fix, verify it in three ways:
- The server config test passes.
- The affected URL now returns the expected status.
- No new matching error appears after the reload time.
For my specific case, I also wanted to confirm that Plesk included the custom domain config files:
grep -n "vhost.conf\|vhost_ssl.conf\|SecResponseBodyLimit\|SecResponseBodyLimitAction" \
  /etc/apache2/plesk.conf.d/vhosts/example.com.conf \
  /var/www/vhosts/system/example.com/conf/httpd.conf \
  /var/www/vhosts/system/example.com/conf/vhost*.conf
Then I retested the affected page in the browser while logged in, because the failure only happened in the editor context. A logged-out curl request can confirm the public site is responding, but it does not prove that a logged-in editor request is fixed.
For a simple public smoke test, I still used curl without dumping the full response body:
curl -k -L -s -o /dev/null \
  -w "HTTP %{http_code} | downloaded %{size_download} bytes | final URL %{url_effective}\n" \
  "https://example.com/"
The important verification was the logged-in browser retest, followed by checking whether a new matching error appeared in the domain error log.
tail -n 120 /var/www/vhosts/system/example.com/logs/error_log \
  | grep -Ei "fatal|error|warning|denied|forbidden|permission|timeout|proxy|upstream|security|php message" \
  | tail -n 60
For my specific incident, the matching error included Response body too large and AH01075. I would only search for those exact strings after seeing them in the log once.
If old errors still appear, check their timestamps. The important question is whether a new matching error appears after the reload and logged-in retest.
Keep a separate list for secondary issues
While checking logs, you may find other warnings or plugin errors that are real but unrelated to the current incident.
I usually keep those in a separate note instead of fixing them during the main investigation. The current issue should have one clear chain of evidence: reported symptom, failing request, matching log entry, targeted fix, and verification.
If another warning does not match the time, URL, client flow, or visible symptom, flag it for follow-up, but do not treat it as the root cause yet.
A compact Plesk debugging flow
If I had to reduce this to a simple flow, it would be this:
- Confirm the domain and document root.
- Check the domain-specific error log.
- Find recent 4xx and 5xx requests in access logs.
- Search rotated logs if current logs do not show the request.
- Build a compact timeline around the reported time.
- Reproduce the issue once.
- Match the new browser failure to a new server log entry.
- Apply the smallest targeted fix.
- Verify with config test, reload, browser retest, and logs.
- Document unrelated issues separately.
The workflow is simple, but it keeps the investigation clean. You are not trying to fix every warning in the log. You are trying to prove which request failed, why it failed, and whether your change fixed that specific failure.
Final thought
The visible error is rarely enough to explain a WordPress issue on Plesk. The useful evidence is usually in the request path, timestamp, status code, client flow, and matching error log entry.
Once those pieces line up, the fix becomes much clearer. You are no longer guessing between PHP, Apache, nginx, ModSecurity, plugins, permissions, or database issues. You are following the failure from the browser to the server log.
It takes a little longer at the start, but it avoids random fixes and gives you a cleaner explanation when you report back to the client.